
Most businesses think they segment their customers. They divide them into age brackets, geographic zones, and demographic categories, give each group a name, and send them slightly different versions of the same email. The segments exist on a slide deck. They rarely drive meaningfully different behaviour in the business.
This is not segmentation. It is categorisation. And the difference matters enormously when you are trying to decide where to invest your marketing budget, which customers to fight hardest to retain, and which are quietly drifting away before you have noticed.
The model I will walk through in this post is different. It is built on behaviour, not demographics. It tells you not who your customers are, but what they have done and by extension, what they are likely to do next. I built this for a leading global QSR brand operating across GCC markets, working across a dataset of over twenty million customers across seven markets. The operational statistics and segment distributions illustrated in this post are drawn from a single market of approximately one million customers, one of the seven the model runs across. Here is how it works, why I made the choices I made, and what happened when we put it into production.
The question is not who your customers are. It is what they have done and what that tells you about what they will do next.
Why Most Segmentation Does Not Drive Revenue
Demographic segmentation has an intuitive appeal. It feels precise. It gives your customer base a shape. But here is the problem: knowing that a customer is a 35-year-old male living in Dubai tells you almost nothing about what he will do next. It tells you nothing about whether he is about to lapse, whether he would respond to a discount or find it insulting, or whether he is the kind of customer worth spending acquisition cost to win back.
Behavioural data tells you all of that. And the RFM model (Recency, Frequency, Monetary) is one of the cleanest ways to extract actionable intelligence from transactional behaviour. It has been around for decades, which is sometimes held against it. I would argue the opposite: a model that has survived decades of retail, e-commerce, and QSR application is not unsophisticated. It is proven.

Why I Chose RFM: The Practitioner's Case
When I was scoping this project, other segmentation approaches were on the table like clustering algorithms, neural network approaches, hybrid models etc. I went with RFM for three specific reasons, and I would make the same choice again.
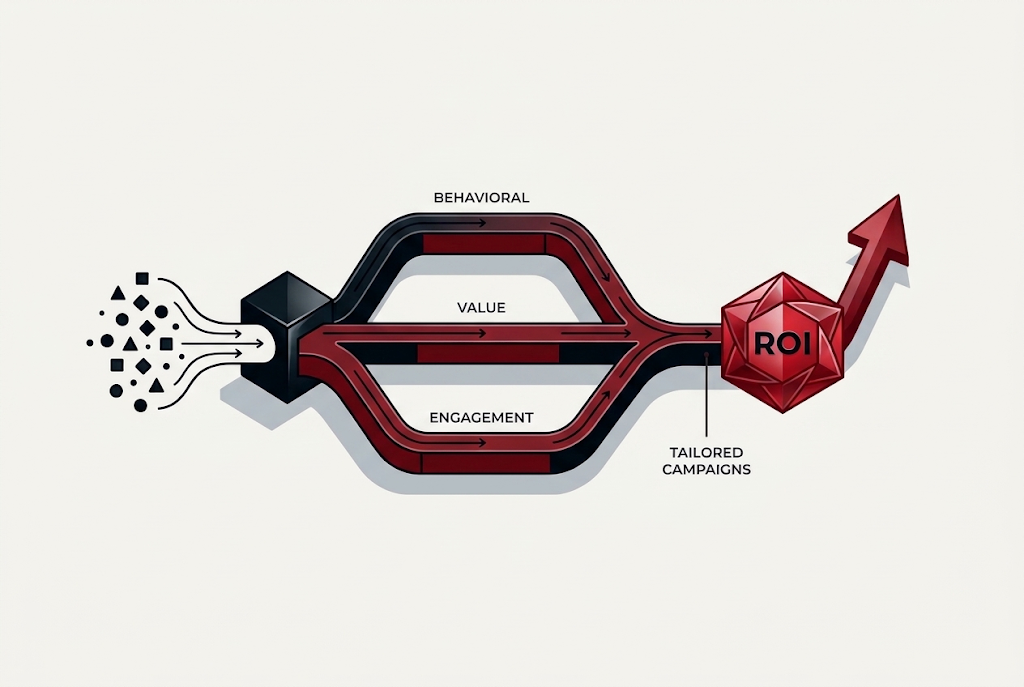
The first reason is business relatability. Marketing teams can immediately connect RFM metrics to their actual objectives. Recency maps to retention. Frequency maps to engagement. Monetary maps to value. These are not abstract model outputs; they are the metrics the business is already trying to move. That removes a layer of translation between the data team and the decision-makers, which is where most analytics projects lose momentum.
The second reason is actionability. Every segment produced by an RFM model has a clear strategic implication: there is no ambiguity about what to do with each group. That matters enormously when you are trying to get a marketing team to act on a model rather than just admire it.
The third reason is the elegance of the percent rank approach. Rather than setting arbitrary thresholds like 'high recency means purchased in the last 30 days', percent rank scoring distributes customers relative to each other. Each customer is scored 0 to 9 per dimension based on where they sit within the full distribution. This means the model works regardless of dataset size, and adapts naturally as customer behaviour shifts over time. No recalibration required every quarter.
What Is RFM: Definitions And Scoring
Before walking through the build, it is worth grounding the three dimensions precisely. What follows are the operational definitions that drive the segmentation logic, not theoretical descriptions, but the working definitions that determine how each customer gets scored and assigned.

One detail worth highlighting from the definitions: Recency is measured as the average number of days since the customer's last order, calculated from the end of the quarter. This quarterly calculation window was a deliberate design choice as it captures meaningful purchase behaviour while preventing customers from shifting between personas too frequently, which would undermine the stability of the activation journeys built on top of the model.
How Scoring Works: Low, Medium, High
Each customer receives a score from 0 to 9 on each dimension, based on their position in the distribution relative to all other customers in the same quarter. A higher score indicates better performance: more recent, more frequent, or higher spend. Customers with no purchases in the quarter receive a score of 0 and are classified separately as Hibernators.

A note on Hibernators: customers with zero transactions in a quarter have no behavioural data to work with, that is no Recency, no Frequency, no Monetary value. They sit outside the main segmentation framework for this reason. They are tracked separately, and reactivation is handled through a distinct channel with a different message from the active segments.
How We Built It: The Methodology
Step 1: Data Extraction And Integration
The starting point was transactional data: customer ID, purchase date, and purchase amount. Extracted from the CRM database and loaded into Google BigQuery for processing. Getting this foundation clean and joined correctly before touching the model saved significant rework downstream, a lesson that applies to almost every data science project I have been involved in.
Step 2: RFM Scoring Via Percent Rank
Each customer received three scores: Recency, Frequency, and Monetary, each calculated as a percent rank from 0 to 9 across the full customer base within the quarter. Score 0 to 3 = Low, 4 to 6 = Medium, 7 to 9 = High. The percent rank method means a score of 9 simply means this customer is in the top tier relative to everyone else, it is inherently comparative, which makes it robust and fair across different cohorts.
Step 3: From 27 Combinations To 7 Named Personas
Three dimensions, each classified as High, Medium, or Low, produces 27 possible RFM combinations. The intellectual work and it genuinely is intellectual work, not just a technical step, is distilling those 27 combinations into segments that are meaningful, distinct, and actionable for a marketing team. We landed on seven active personas, each with a name that gives the business a shared language for talking about customers.
The Seven Personas: Definitions And Activation

The persona definitions in the dashboard above are the exact ones used in production. A few that deserve specific comment in the context of this market:
Champions (High·High·High) represent just 1.2 percent of the base: 7,600 customers. The instinct is to focus everything on them. The model shows they are already engaged; the priority is retention and referral leverage, not acquisition spending.
At Risk customers have previously high Frequency and Monetary scores but declining Recency. These are valuable customers who have started drifting. The window to win them back is narrow and the cost of losing them is high; this segment justifies significant win-back investment.
Need Attention is the largest single segment at 24 percent: nearly 148,000 customers. Moderate recency but declining frequency and spend. These customers are still reachable but need a reason to re-engage before they tip into At Risk.
Recenters are an interesting edge case: high recency but low frequency and monetary. They have come back recently, possibly after a break, but have not yet rebuilt their purchase pattern. High growth potential if the next few interactions are positive.
What The Data Revealed
The most striking output was not the segment definitions; it was the distribution. Of the approximately one million customers in this market, 614,000 showed meaningful engagement. The remaining customers fell into the disengaged segments: Need Attention, At Risk, and Low Activity.
▲ The split that reframes the entire marketing conversation. The re-engagement opportunity is larger than the retention one.
That ratio changes the conversation completely. The instinct in most businesses is to concentrate resources on the best customers. The model showed that the disengaged population was larger than the engaged one and within it, the At Risk segment (high historical value, declining activity) represented a win-back opportunity that was not being addressed systematically.
Champions, at just 1.2 percent of the base, were receiving the same generic communications as the Low Activity segment. The model makes that untenable. Once the data makes the distribution this visible, it becomes very difficult to justify treating your most loyal customers identically to your most dormant ones.
The trend analysis across quarters added a further dimension to this picture, showing how segment populations shift over time and which direction customers are moving between personas.

The trend data is particularly instructive for planning. The Need Attention segment grew from approximately 80,000 customers to 129,000 over six quarters, not because the overall base shrank, but because customers were migrating from healthier segments without sufficient re-engagement intervention. A segmentation model without trend tracking misses this drift entirely.
What Happened When The Model Went Live
The CRM journeys built on this model are live and running. Hyper-personalised communications, offers, and experiences are being delivered at the segment level across customer-facing touchpoints including the app. I want to be honest about where we are on results: the activation cycle is still in progress, and solid ROI data takes time to accumulate meaningfully.
What we do have is early signal, and it is encouraging. The transition analysis is one of the most revealing outputs showing not just where customers are today, but how they are moving between segments quarter over quarter.

The transition chart above shows something meaningful: customers from At Risk, Need Attention, and Low Activity segments are moving toward Promising, not in vast numbers yet, but consistently. That is early evidence that the activation journeys are working. Customers who were drifting are being caught and redirected.
The most telling business indicator, however, is not in the data. It is in how the marketing team uses the model. Marketing heads are now opening the dashboard before campaigns to form hypotheses: 'if we run this offer, which segments respond and which do not? What does the model tell us about receptiveness?' When a team starts treating a model as a thinking tool rather than a reporting output, the model has embedded. That is a different kind of success than a revenue uplift, but it is arguably the more durable one.
When a marketing team starts forming hypotheses with your model before campaigns, the model has already succeeded, even before the ROI number arrives.
What This Means For Your Business
You do not need a million-customer dataset to apply this. RFM works at any scale where you have transactional history and most businesses that have been operating for more than a year have more behavioural data than they realise. Three things to take from this post:
Start with the data you have. Customer ID, transaction date, and transaction value is enough to build a functioning RFM model. You do not need a fully matured data warehouse to start.
Name your segments. The step from 27 combinations to 7 named personas sounds like simplification. It is actually the most important step as it is what makes the model usable by people who did not build it. A segment called 'At Risk' gets acted on. A segment labelled 'Cluster 4' does not.
Measure adoption before ROI. The first sign a segmentation model is working is not a revenue uptick; rather it is the marketing team opening the dashboard before a campaign. If they are not using it, the model has failed regardless of its technical accuracy.